Best car manufacturers 2024
Drivers share real-world verdicts on the car manufacturers that they’re living with
We’ve already published our list of the best cars to own from the 2024 Driver Power customer-satisfaction survey. Now the UK’s major brands take their turn in the spotlight, as we crunch the numbers to rank the UK’s best car manufacturers. The best car brands are those that provide the greatest level of satisfaction to their owners, and they’re ranked based on the thousands of responses to the 2024 Driver Power poll.
The format is similar to the Driver Power new-car survey, but instead of comparing and ranking responses for individual models, we collate data for a range of vehicles from respective brands to give a picture of the overall satisfaction level each car manufacturer provides.
As with the new-model poll, responses are generated across 10 Driver Power categories, with each score made up from a variety of responses to detailed questions about vehicle or ownership attributes that are relevant within that section. The category responses themselves are then weighted to generate the overall scores, and the final satisfaction ranking. So which manufacturer takes Driver Power gold in this Olympic year?
Top 10 car manufacturers 2024
Read on to find out the top ten best car manufacturers in 2024, while further below you can view the full table of all 32 brands in this year’s survey...
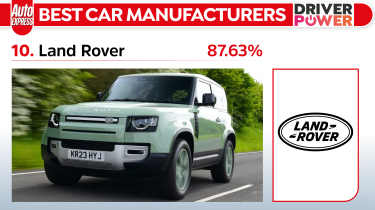
10. Land Rover - 87.63%
If it weren’t for reliability, running costs and overall value, where it’s in last (or nearly last) place for every attribute, Land Rover would be all-but unstoppable. Customers love the exterior (first) and interior design (fourth), fit and finish (exterior seventh/interior sixth), ride and handling (third), drivetrains (fourth), and practicality and boot space (sixth). But with 40.6 per cent of owners surveyed reporting faults, plus 29th place for economy and servicing, and 31st for insurance, it’s unsurprising that owners rank value for money in last position.
- Key points: Owners share much love, but reliability and running costs are issues
- Share of owners with faults: 40.6%
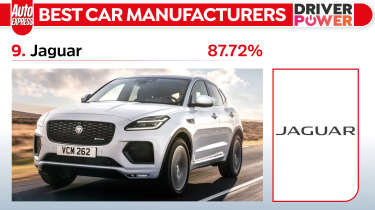
9. Jaguar - 87.72%
Jaguar shares many of the problems faced by Land Rover buyers, just not quite to the same degree; or perhaps owners are more sympathetic, given a level of reported faults that’s higher than its JLR stablemate. Either way, 18th for quality and reliability to Land Rover’s 30th, MPG and running costs at 25th vs 32nd, and value scores of 26th vs 32nd put Jag a place ahead in the table. That’s despite Land Rover acing it on exterior design and quality (2nd vs 10th), practicality (sixth vs 12th), interiors (fourth vs eighth) and powertrains (fourth vs sixth).
- Key points: Jaguar, like Land Rover, is fab but flawed, say owners
- Share of owners with faults: 43.6%
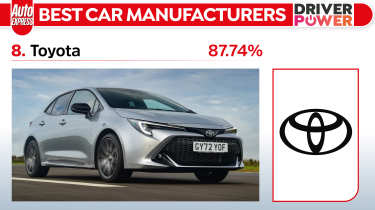
8. Toyota - 87.74%
Toyota hits plenty of high notes on its way to eighth place overall, including fourth for quality and reliability, fifth for ride and handling, and MPG and running costs. The firm is second for satisfying economy, while a series of top 10-ranked attributes accounts for strong ride and handling scores, including a seventh for driving pleasure. There are good results in the infotainment category, apart from a 27th for built-in sat-navs. Toyota also trips up a little with 27th for interior cabin storage, and 24th in the practicality and boot-space section.
- Key points: Toyotas were always reliable, and are now great to drive
- Share of owners with faults: 18.1%
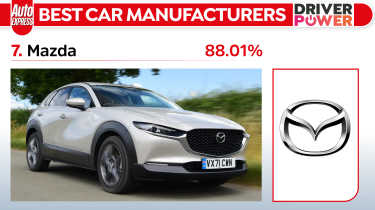
7. Mazda - 88.01%
Second place for infotainment helps Mazda, with owners loving the user-friendliness of controls (first), smartphone connectivity (second) and the balance between touchscreen and physical controls (third). The brand is eighth for safety features and overall value, ninth for exterior design and finish, and 10th for quality and reliability. There are also top-10 places for all attributes in the safety-features category, and for interior style and finishes, front-seat comfort, and cabin storage. Acceleration (29th) and all-round visibility (26th) are the only negatives.
- Key points: Solid all-round performances and great infotainment
- Share of owners with faults: 25.0%
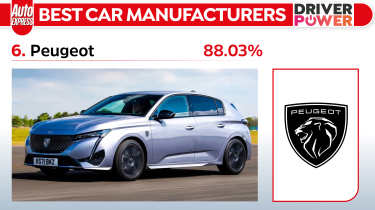
6. Peugeot - 88.03%
Consistency is what clinches sixth spot overall for Peugeot, and it’s a brand that performs strongly across all categories, with no major slip-ups. Its worst showing is for infotainment, where it can’t break into the top 10 for any attributes, and where user-friendliness is in 22nd place, with similar scores for phone connectivity and the balance between touchscreen and manual controls. MPG and running costs are seventh, along with powertrains, while ride and handling are eighth. Peugeot is 12th in the interior category, but value for money trails a little in 14th.
- Key points: Strong category scores across the board
- Share of owners with faults: 20.8%
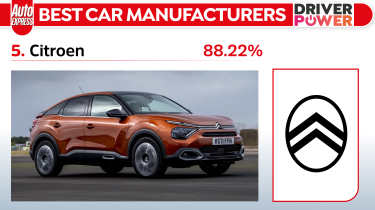
5. Citroen - 88.22%
Citroen’s second place for running costs, including a fourth for MPG and two second spots for servicing and insurance, give the brand its best category score. As with Peugeot, there’s impressive consistency across the rest of the categories too, with owners rating value fifth. The brand’s worst area is a still-decent 14th for exterior style and finish. Many section attributes are ranked in the top 10, with driving pleasure (16th) and road handling (20th) the outliers. Front-seat comfort (sixth) and luggage capacity (fourth) are the highlights.
- Key points: Running costs are super-satisfying, say owners
- Share of owners with faults: 15.1%
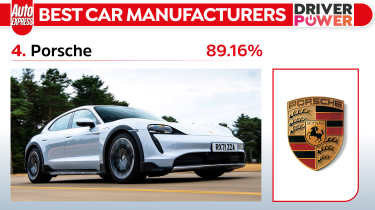
4. Porsche - 89.16%
With one of the highest reported fault counts in the survey, Porsche must be doing something right to ensure customers rank brand satisfaction second overall in the quality and reliability category; a first place for the former and 10th for the latter attributes do the trick. The German manufacturer is second in the ride and handling category, and it excels for exterior design (second) and finish quality (first), ranking similarly for interior design and quality in this year’s survey. But owners only rate Porsche 25th for value for money.
- Key points: Superb driving and quality scores, but the brand struggles on value
- Share of owners with faults: 36.0%
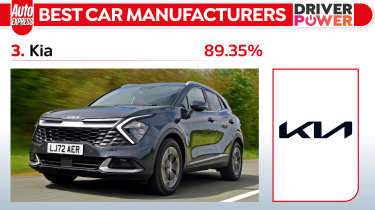
3. Kia - 89.35%
With only one category score outside the top 10, Kia is well worthy of its place on the podium. It means every category is a highlight, but owners rank both value and infotainment third overall. There are fourth places in the MPG and running costs, and practicality sections, while exteriors are ranked fifth, and interiors sixth. Ride and handling, reliability, and safety features finish seventh, leaving only powertrains outside the top 10 – but only just. They rank 11th, thanks to ‘relatively’ poor ratings of 17th and 12th for gearbox smoothness and acceleration.
- Key points: Excellent ratings across the board put Kia on the podium
- Share of owners with faults: 24.3%
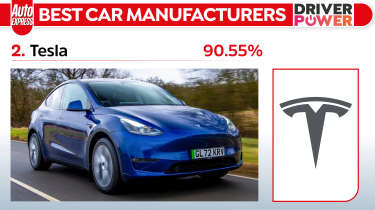
2. Tesla - 90.55%
Three category wins power Tesla’s surge to second place. It aces powertrains due to incredible acceleration and smoothness, MPG and running costs thanks to cheap servicing costs and home charging, and infotainment courtesy of the almost-iconic central tablet control panel. But there’s much more to Tesla, say owners, who rank their cars second most satisfying for boot space and practicality, plus safety features.
Ride and handling only make ninth spot, due to a poor 24th for ride smoothness. Otherwise owners rate their cars third for braking, sixth for steering response and second for driving pleasure. But it’s build quality that disappoints buyers the most. Exterior fit and finish is bottom of the table in 32nd, while interior quality is 24th. Most reported faults are low-impact issues, say owners, who rank the brand’s reliability in a remarkable second place.
- Key points: Turbine-like power, cheap running costs and cabin tech lead the way
- Share of owners with faults: 37.9%
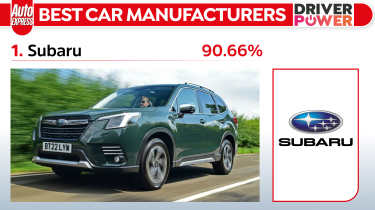
1. Subaru - 90.66%
It’s remarkable to think that a brand which seemingly passes so many drivers by, can perform so impressively in a national survey that’s designed to take the temperature of owners’ engagement with their cars. Enter Subaru, with five category wins, and only two sections where it’s ranked outside the top five, to make that point emphatically.
That said, Subaru has built its reputation for rugged reliability and four-wheel-drive capability through a customer base located primarily in more rural locations. But there’s clearly something special about a brand that provides such exceptional levels of satisfaction to its target audience.
Getting any negativity out of the way first, 14th place for MPG and running costs includes a 27th for fuel economy, while servicing is eighth and insurance ninth. There’s also a 28th place for acceleration, which drags the drivetrain category score to 12th. It’s all rosy once they’re out of the way though, as Subaru notches up top-10 ratings in 34 out of the 36 individual attributes across all 10 categories; and top-five ratings in 27 of them.
As a result, scores in the infotainment and exterior categories secure fourth-place ratings, while owners rate Subaru top for interiors, practicality and boot space, ride and handling, safety features and quality and reliability, while value for money falls into second place behind only Dacia.
Add a raft of attributes with first-place ratings and put simply, in the 2024 Driver Power Brand survey, Subaru cleans up!
- Key points: Subaru excels everywhere, except fuel economy and acceleration
- Share of owners with faults: 27.9%
How did the other car brands perform? Best and worst car manufacturers 11 to 32
You've seen the top 10 best car manufacturers from Driver Power 2024 but how did the others get on? Below you'll find the remainder of the 32 brands in this year's survey running from the best of the rest to the worst performers, which may feel like changes need to be made to keep their customers happy.
11. Honda - 87.56%
Honda scores four top-10 category finishes, with an eighth for practicality and boot space, and sixths for quality, reliability and running costs. Interior attribute scores add up to 10th place in this section, with fourth for rear legroom and 10th for quality. Economy satisfaction is fifth and service costs fourth, but insurance is 25th. Owners like some elements of their hybrid powertrains more than others, with gearbox smoothness ranked fifth, but engine noise 28th. Exterior styling comes 27th, interior style 21st, and fit and finish 10th.
- Key points: Roomy with low running costs, but mixed hybrid reviews
- Share of owners with faults: 13.6%
12. Lexus - 87.17%
Legendary Lexus quality and reliability lead the way for the brand this year, but fourth for the latter and third for quality adds up to ‘only’ third place in the category. There are top-10 finishes in areas as diverse as engine and gearbox (fifth), ride and handling, and safety features (both sixth), exterior (seventh), and interior (ninth). But practicality and boot space are 22nd and MPG and running costs 23rd, which explains the 17th place for value. A 27th for infotainment is the only section where Lexus is comprehensively beaten by German rivals.
- Key points: High scores for reliability, but practicality is not the best
- Share of owners with faults: 17.9%
13. Alfa Romeo - 86.86%
Alfa Romeo would probably prefer to be associated with driving thrills ahead of safety, but its performance is lifted by a fourth in the latter category. The scores are only average for the number of safety features and how well they work, but owners love how easy it is to turn them off (second). There’s a 28th place overall for quality (16th) and reliability (32nd), but a number of rivals have much higher levels of reported faults. Acceleration, steering and road handling are ranked third, while Alfa is first for its balance of touchscreen and physical controls.
- Key points: Good scores for driving, but reliability is less satisfying
- Share of owners with faults: 26.7%
14. BMW - 86.69%
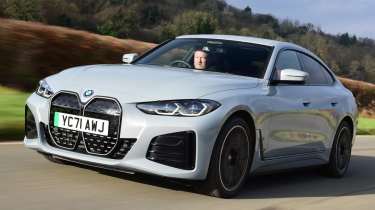
There’s clear water between BMW and its chief rival Mercedes. BMW ranks almost as poorly as Merc for value (28th versus 31st), but gets better owner feedback for powertrains (9th vs 16th), ride and handling (16th vs 24th), safety features (15th vs 22nd), infotainment (15th vs seventh) and reliability (15th vs 27th). BMW’s best attribute scores are sixth for acceleration, with similar rankings for the nav, touchscreen and balance of controls. The brands are pretty evenly matched for poor running-cost satisfaction, with BMW service costs ranked 27th.
- Key points: Infotainment, reliability and its car’s driving dynamics push BMW ahead of Mercedes
- Share of owners with faults: 21.4%
15. Nissan - 86.54%
Owners have ranked Nissan’s performance in the middle third for every category in this year’s survey. There’s a best of 13th for value, while the ride and handling, plus quality and reliability, are the least good, in 20th. There’s a single top-10 attribute score for child-friendly features, 26th for overall quality, and 31st for road handling, the firm’s worst-scoring category. Seating flexibility and visibility from the driver’s seat are ranked 24th, but fuel economy is 13th, and the user-friendly controls, audio and climate systems are just outside the top 10.
- Key points: Middle-of-the road scores across the board for Nissan
- Share of owners with faults: 18.2%
16. Volvo - 86.48%
Despite its heritage, Volvo ranks 13th in our safety category, and it’s not for a shortage of equipment, which is ranked third, but rather the functionality (19th) and ease of turning features on and off (16th) that disappoint owners. Volvo is second for its interiors, with third spots for front-seat comfort and rear legroom. Cabin style and finish are both ranked fifth, while exterior style and quality come sixth. There’s a fifth in the practicality category, but powertrains (29th), running costs (31st) and value (30th) all suffer from poor owner satisfaction.
- Key points: Well liked interiors, but running costs and value score poorly
- Share of owners with faults: 26.0%
17. Hyundai - 86.36%
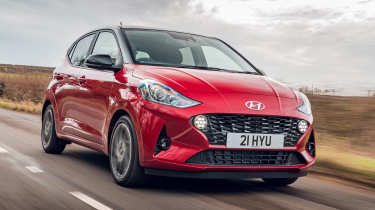
The Korean firm is 10th for its infotainment, 11th for MPG and running costs, and 12th for overall value, while safety features are 16th. Every other category falls into the lower half of the table, with owners least satisfied by their exteriors, where styling is 23rd, and quality and finish 27th. Cabin quality is also rated poorly, but the interior category is boosted by slightly better scores for seat comfort, visibility and rear legroom. Rankings for ride and handling category attributes all fall in the final third of the survey, with driving pleasure coming in at 25th.
- Key points: Infotainment is given the biggest thumbs up, with value close behind
- Share of owners with faults: 22.8%
18. Cupra - 86.28%
SEAT’s former label for sporty cars is now a brand in its own right, and it bags third places for the powertrain and exterior categories, plus fifth for interiors, 10th for ride and handling, and 11th for practicality and boot space. But the usability (32nd) and function (30th) of safety systems isn’t well regarded, nor are the infotainment systems. Cupra is last for the user-friendliness of its controls and switchgear, and the balance between physical and touchscreen controls. The climate control and entertainment systems rank one place higher, in 31st.
- Key points: Style and dynamics do well, but cabin tech scores are low down
- Share of owners with faults: 23.1%
19. Suzuki - 86.26%
Despite boasting the lowest reported fault scores in the survey by a huge margin, Suzuki is only 11th in the quality and reliability category, as owners award satisfaction ratings of 18th and eighth for the two attributes. Suzuki is third for running costs, due to its results for MPG (third), insurance (sixth) and servicing bills (seventh). Overall brand value is ranked sixth, but most other scores are middle of the road or poor, including 25th for interior style, 27th for luggage capacity, 28th for exterior quality, 30th for interior quality and 31st for ride quality.
- Key points: Satisfyingly cheap to run, and an excellent, low fault record
- Share of owners with faults: 8.9%
20. MINI - 86.26%
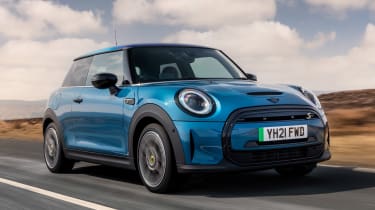
A sixth place in the infotainment category sneaks MINI into the top 20 overall, but it scores no better than 14th for safety features in other sections, and 25th for powertrains and interiors. Acceleration is in 31st place, while rear legroom drags the interior score down. Cabin style ranks 11th, but exterior design is 20th. Practicality scores are low, but owner feedback on dynamic qualities is mixed, with driving pleasure eighth and road handling 15th. Steering response (28th), brake response (29th) and ride quality (30th) are marked down.
- Key points: A thumbs up for interiors, but exterior style is less satisfying
- Share of owners with faults: 12.7%
21. Mitsubishi - 86.09%
Mitsubishi drivers appear very pleased with their cars’ practicality (third) and quality and reliability (fifth). Boot space (fifth) and cabin storage (second) are the top attributes in the former category, while in the latter there’s a first for the reliability attribute, but 10th for quality. The brand is ninth for infotainment and 10th for value, but running costs are rated 29th, with fuel economy 30th. Mitsubishi is last for acceleration and exterior styling, and 30th for interior styling and front-seat comfort, with safety features ranked in 29th place.
- Key points: Unbeatable reliability, but Mitsubishi falls down elsewhere
- Share of owners with faults: 15.6%
22. Dacia - 86.01%
Owners say Dacia offers the most satisfying value, with the brand winning the category outright. MPG and running costs are eighth, yet within that category Dacia is sixth for economy and 12th for servicing costs. Owners also appear happy with Dacia’s built-in sat-navs (third), the balance between physical and touchscreen controls (second), plus boot space (seventh). But there are 31st and 32nd places for exterior and interior style and quality, while ride and handling is 28th and powertrains 26th. Dacia is one rung off the bottom for driving pleasure.
- Key points: Value and boot space satisfy owners; quality and dynamics less so
- Share of owners with faults: 20.9%
23. Skoda - 86.00%
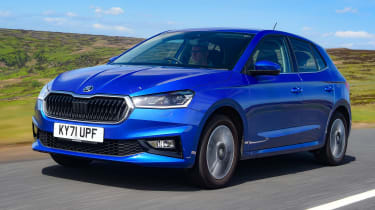
The Czech brand can’t match its VW Group stablemate SEAT for value (ninth), but is seventh for practicality and boot space. Skoda earns a 13th for its MPG and running costs, while owners rate reliability 16th. Buyers are less enthused by the infotainment systems (28th), while the number and usability of safety systems is rated 26th. The ride and handling (25th) and powertrain (24th) category scores suggest owners are also unimpressed here. But Skoda wins plaudits for boot space (second), cabin storage (fifth) and rear legroom (sixth).
- Key points: Great for luggage and passengers, but underwhelming elsewhere
- Share of owners with faults: 23.7%
24. SEAT - 85.84%
SEAT is fourth for satisfying value and gains two 15th positions in the exterior and engine and gearbox categories. Ride and handling plus MPG and running costs are both ranked 18th, but quality and reliability, and interiors are 22nd and 24th respectively. Infotainment systems also net a poor 26th place. SEAT’s highest individual-attribute scores are 12th for boot space and gearbox smoothness, 13th for steering response, and 15th for braking responsiveness plus rear-seat legroom. Seating flexibility is 29th and ride smoothness is a poor 27th, too.
- Key points: Great value, but not much cop on seat flexibility or ride comfort
- Share of owners with faults: 25.0%
25. Mercedes - 85.55%
Mercedes has a similar set of scores to its premium rival Audi, but there are some key differences. For instance, Mercedes performs best in the powertrain (16th) and infotainment categories (15th), but is 30th for running costs and rock bottom for servicing-cost satisfaction. A 27th spot for quality and reliability is worse than Audi’s by six places, thanks to the latter attribute ranked 29th. The firm’s most satisfying attributes are 10th places for acceleration, built-in sat-nav systems and climate control. Only Land Rover scores are worse for value for money.
- Key points: Owners don’t rate the value for money, but do like the performance
- Share of owners with faults: 26.3%
26. Vauxhall - 85.50%
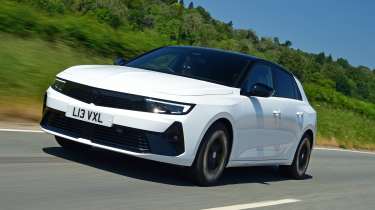
A lacklustre performance, but at least Vauxhall is in the top half of the poll for economy and running costs, scoring ninth in the category. Its lowest satisfaction scores are for practicality (29th) and interiors (27th), where cabin storage, few child-friendly features, rear legroom and poor visibility from the driver’s seat drag the manufacturer down. Powertrain scores would be higher if they weren’t let down by poor gearbox satisfaction, while 27th place for climate-control systems hits the infotainment ranking. The overall quality attribute is a poor 30th.
- Key points: Decent running costs, but little else to celebrate
- Share of owners with faults: 21.0%
27. Audi - 85.43%
It may be the worst-performing premium brand here, but Audi can take some comfort from the fact Mercedes is only a couple of rungs higher up the ladder when it comes to customer satisfaction this year. Audi does best in the interior category (16th), but its highest category attributes are visibility (ninth) and rear legroom (13th), rather than style (19th) or quality (20th). The brand does well in areas such as acceleration and seating versatility, both 14th, but value overall is 29th. Steering and braking response are last and 31st, respectively.
- Key points: Customers don’t rate value, or brakes and steering
- Share of owners with faults: 21.3%
28. Renault - 85.30%
Renault’s best category score is 12th for running costs, with cheap servicing, in ninth, being the attribute that leads the way, followed by 16th for tax and insurance, and 18th for economy. Owners rate their car exteriors 16th, safety features 28th, and the infotainment systems 21st. The interiors don’t rank highly either, with front-seat comfort in 29th and visibility from the driver’s seat last. Powertrains also don’t fare well, with acceleration and smoothness scores near the bottom of the table. An 11th place for boot-space satisfaction is a bonus, though.
- Key points: Running costs are tolerable, and boot space a highlight
- Share of owners with faults: 24.4%
29. Volkswagen - 84.80%
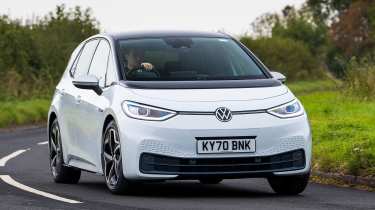
‘If only everything in life was as reliable as a Volkswagen’, as per the advertising, we’d all be in a spot of bother. At least if our Driver Power respondents are to be believed, that is, because they rate reliability and quality 28th and 27th respectively. Highlights elsewhere are few and far between, with a 17th place for practicality the best VW can muster at the category level. Dig a bit deeper and we find a 12th spot for rear-seat legroom, and 16th for fuel economy, but VW’s satisfaction levels can’t break into the top half of the survey anywhere else.
- Key points: Luckily, not everything is as reliable as a VW…
- Share of owners with faults: 23.4%
30. Ford - 84.58%
Ford's best results are 21st place for MPG and running costs, and 24th in the value category. The company also trails in 31st in the quality and reliability, and ride and handling categories, 30th for the practicality and boot space sections, 29th for interiors, 28th for exteriors and 27th for powertrains. There’s a more positive 16th for touchscreen visibility and sensitivity, but otherwise Ford’s satisfaction scores are trailing in the bottom third of the survey, suggesting most customers are, at best, underwhelmed by their ownership experience.
- Key points: Poor results across the board for the Blue Oval
- Share of owners with faults: 20.8%
31. Fiat - 84.13%
Fiat’s focus on small city cars in recent years appears to be at the root of its poor showing, with the worst scores relating to practicality and boot space, where Fiat finishes last, and 30th places for powertrains, interiors, and ride and handling. Overall quality and reliability results are low too, despite relatively low numbers of owners reporting faults and mid-table scores for interior and exterior quality, plus a 10th for exterior design. Highlights include fifth for insurance cost and eighth for fuel economy, but otherwise Fiat’s numbers are average at best.
- Key points: Small may be beautiful, but it’s not very satisfying
- Share of owners with faults: 11.8%
32. MG - 82.01%
MG may be taking sales from better-known rivals, but our poll suggests the brand needs to work harder if it wants to keep customers. Aside from seventh place for value, the Chinese-owned firm finished in last place in the powertrain, exterior, ride and handling, safety features, and reliability categories. MG adds 31st spot for categories including interior, practicality and boot space, and infotainment. A 27th place for MPG and running costs is MG’s second-best category performance, dragged down by the least satisfying fuel economy score in the survey.
- Key points: MG has work to do, if the brand wants its customers to stay loyal
- Share of owners with faults: 28.1%
Best car manufacturers 2024: 1-32
| 1 | Subaru | 90.66% |
| 2 | Tesla | 90.55% |
| 3 | Kia | 89.35% |
| 4 | Porsche | 89.16% |
| 5 | Citroen | 88.22% |
| 6 | Peugeot | 88.03% |
| 7 | Mazda | 88.01% |
| 8 | Toyota | 87.74% |
| 9 | Jaguar | 87.72% |
| 10 | Land Rover | 87.63% |
| 11 | Honda | 87.56% |
| 12 | Lexus | 87.17% |
| 13 | Alfa Romeo | 86.86% |
| 14 | BMW | 86.69% |
| 15 | Nissan | 86.54% |
| 16 | Volvo | 86.48% |
| 17 | Hyundai | 86.36% |
| 18 | Cupra | 86.28% |
| 19 | Suzuki | 86.26% |
| 20 | MINI | 86.26% |
| 21 | Mitsubishi | 86.09% |
| 22 | Dacia | 86.01% |
| 23 | Skoda | 86.00% |
| 24 | SEAT | 85.84% |
| 25 | Mercedes | 85.55% |
| 26 | Vauxhall | 85.50% |
| 27 | Audi | 85.43% |
| 28 | Renault | 85.30% |
| 29 | Volkswagen | 84.80% |
| 30 | Ford | 84.58% |
| 31 | Fiat | 84.13% |
| 32 | MG | 82.01% |
Take the Driver Power survey now
Our Driver Power survey relies on owners, so why not help future buyers by contributing towards 2025's results. Take the Driver Power survey now and you'll be entered into a prize draw where you could win a £100 Amazon voucher.
Find a car with the experts


