What is WLTP? Official car fuel economy and emission tests explained
The latest WLTP tests mean lower on-paper fuel economy, higher emissions and revamped model ranges
Significant changes to new car emissions and fuel economy testing came into effect in September 2018. The latest mpg and emissions testing standards are known as the WLTP (World Harmonised Light Vehicle Testing Protocol) and the assessment measures a car’s fuel economy and emissions in a range of driving conditions in a laboratory environment. A primary aim of the WLTP tests was to give drivers a more realistic picture of the fuel consumption achievable and emissions produced by a car while they are driving it.
All new cars that have been sold since September 2018 have to be assessed under WLTP, and the process is much more stringent than the previous NEDC (New European Driving Cycle) assessments that WLTP replaced. Under the previous NEDC assessment the official fuel economy figures quoted by manufacturers were often significantly better than car owners found they could achieve in the real world. WLTP narrowed the gap between the test results and what was possible in real world driving but motorists still regularly report discrepancies.
This means that WLTP on-paper fuel economy and emissions figures for almost every new car on sale are worse than if the same car was tested under NEDC testing. It’s estimated that measured CO2 emissions rose between 13 and 22 per cent under WLTP testing criteria compared to the pre-2018 NEDC tests. Read on if you want to learn more about how WLTP works and how it can affect you.
What is WLTP?
The latest WLTP tests represent a root and branch change compared to the NEDC assessments they replaced. While WLTP tests are still laboratory-based, the cars are ‘driven’ for longer distances, at higher speeds, and more variables are taken into account when compared to NEDC tests.
Individual cars with different alloy wheel sizes and trim levels, for example, must be assessed individually under WLTP, as larger alloy wheels negatively impact economy and emissions. It's the same story for the extra weight added equipment on higher trim levels; options such as roof racks, which affect aerodynamics, are also taken into consideration. Other changes include faster acceleration and sharper braking, while cars are put through different levels of assessment depending on their power-to-weight ratios.
WLTP assessments also take into account:
- Acceleration
- Braking
- Stoppages
- Rolling resistance
- Engine and gearbox
- Optional equipment
Generally speaking, vehicle testers will examine the lightest and heaviest variants of any given model and then apply a mathematical formula to determine the consumption figure for the rest of the range. Every vehicle goes through an identical test cycle, making it easier for drivers to compare vehicles.
What’s the difference between WLTP and NEDC?
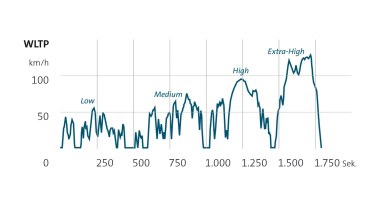
As mentioned above, WLTP testing is much stricter than NEDC assessments, as the new test was designed to give a better picture of ‘real world’ emissions levels and fuel consumption of a car. While on paper the WLTP and NEDC process may look similar, there are some big differences between the two tests. Not only does the WLTP test take a total of 30 minutes (10 minutes longer than the NEDC tests), data collected can take up to five days to process, more than double the time taken for NEDC tests.
| Criteria | NEDC | WLTP |
| Test length | 11km (6.8 miles) | 23.25km (14.4 miles) |
| Average speed | 34kmh (21.1mph) | 46.5kmh (28.9mph) |
| Max speed | 120kmh (74.6mph) | 131kmh (81.4mph) |
| Gear changes | 120kmh (74.6mph) | Varies based on car |
| Types of driving | Two phases: urban/non urban | Up to four phases: low, middle, high, extra high |
| Impact of optional extras | Not taken into account | Taken into account |
How does WLTP affect me?
WLTP tests help create more transparency around the fuel consumption and emissions produced by a car.
NEDC tests were often criticised for returning figures which were unrealistic or unachievable in the real world. Official figures from one test would be broadly applied to an entire model range, too, reducing accuracy. The more in-depth and stricter WLTP tests aimed to reduce these discrepancies while also taking into account differences between a top-of-the-range model and an entry-level car, meaning the official figures quoted should be closer to those seen by motorists. Drivers should, therefore be able to make more informed decisions and figure out if a car or van meets their needs before they buy.
Though the gap between official figures and what motorists get at the pumps or charging stations did narrow with the arrival of WLTP, complaints from consumers about the difference between WLTP figures and ‘real-world’ performance persist. Part of the issue remains that there are so many variables in real-world driving that the WLTP laboratory tests strip away in a bid to achieve consistency and comparability.
WLTP tax implications
Because both the first year of road tax (VED) and company car tax are based on a car’s CO2 emissions, the amount of tax that consumers pay on their cars is directly influenced by WLTP assessments because they set the official CO2 emissions for every car.
When WLTP was first introduced in 2018, to avoid consumers facing a significant tax hike as a result of increased emission measurements, WLTP figures were converted back to NEDC figures until April 2020. These converted NEDC figures were used for the purposes of tax calculations.
The EU developed a computer programme, known as CO2MPAS, to replicate NEDC figures from WLTP tests, but since April 2020, only WLTP measurements have been used for tax calculations on all new cars.
Plug-in hybrids and electric cars: extra tests
Plug-in hybrids, or PHEVs, which can drive on all-electric power for around 20 to 60 miles and be recharged from a plug, are tested in a different manner from conventional petrol and diesel cars when being assessed under WLTP.
One test is started with the PHEV’s battery fully charged, and the car is put through repeated WLTP cycles until the battery is fully depleted. A second test then takes place, which begins with the PHEV’s battery being totally empty, the car being powered solely by its internal combustion engine (along with any energy generated from regenerative braking). A PHEV’s CO2 emissions are calculated based on the average of these two tests.
Plug-in hybrids are still one of the most controversial classes of car when it comes to WLTP testing as the quoted MPG figures can be particularly difficult for drivers to replicate in the real world, depending on their use and charging patterns. Changes to WLTP testing due in 2025 are designed to make plug-in hybrid results more representative.
Electric cars are also assessed more stringently under WLTP than they were under NEDC. They start with a full battery, and are subjected to the same fuel economy cycle petrol and diesel cars undertake. Once the cycle is complete their batteries are recharged, and a meter measures how much electricity has been used during the trial. The EV’s range is calculated based on how far and how fast it has travelled during the test.
Where do real-world RDE tests come into it?
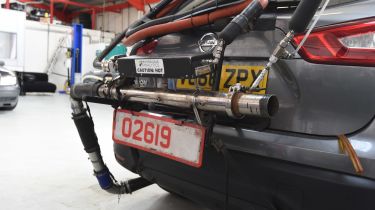
European legislators introduced new real-world tests at the same time WLTP laboratory assessments came in. The RDE (Real Driving Emissions) test sees cars have a Portable Emissions Measurement System (PEMS) fitted to their rear to measure particulate matter, fuel economy and nitrogen oxide (NOx) emissions, and taken out on public roads for 90-120 minutes.
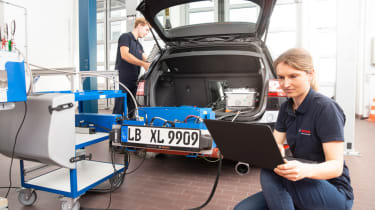
RDE tests have to be carried out and logged by manufacturers – both a particulate matter and NOx emission element have to be passed.
Are cars assessed under WLTP still Euro 6 models?
Yes. Euro 6 standards arrived in 2014-15, setting a limit of 80 milligrams per kilometre (mg/km) for NOx for diesel cars (60mg/km for petrols) and 4.5mg/km of particulate matter (microscopic soot and other waste particles) for all passenger cars.
WLTP and RDE economy and emissions tests could still be unrealistic
While WLTP test figures are more accurate and representative than those produced under the older NEDC tests, many motorists still struggle to get close to the official manufacturer stated figures.
In April 2024, a study from the European Commission found that most cars are, on average, 20 per cent less fuel efficient and produce more emissions than the official WLTP figures suggest.
The report studied a sample of 600,000 cars and found that petrol cars were typically 24 per cent more polluting and fuel inefficient then the official ratings suggested, while diesel models were 18 per cent short of their official figures. Plug-in hybrid cars performed even worse, typically emitting more than three-and-a-half times more CO2 in real world driving than their official WLP numbers.
The Commission's report said that there need to be further steps taken to ensure WLTP tests are more representative of everyday driving conditions, taking into account things like weather and air conditioning usage. In 2025, revised WLTP tests for PHEVs will be implemented using more real-world data to provide a more accurate representation of when the car uses electric power and when the engine eventually kicks in, with other tweaks coming in the coming years to improve laboratory test figure accuracy.
Now check out our list of the most economical cars on sale...
Find a car with the experts


