MPs claimed £4.3m in motoring expenses in past three years
Shock figures uncover MPs’ expense claims for tolls, parking and the London Congestion Charge
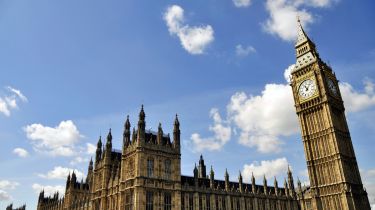
Britain's Members of Parliament have racked up nearly £4.3million in motoring-related expense claims in the past three years.
Taxpayers have been asked to foot the bill for MPs’ yearly expenditure for claims such as parking, the London Congestion Charge and toll fees, plus the use of their own vehicles.
Auto Express has calculated totals for each of the 11 regions defined by the Independent Parliamentary Standards Authority (IPSA), with around £1.4million claimed by MPs per year – an average of £130,000 per region. While MPs in the South West claimed the most in 2014/15, at £179,629, our data reveals the 28 MPs in the West Midlands have the highest expense bill over the past three years. The region’s MPs claimed £550,305 on motoring expenses from 2012 to 2015 – a yearly average of £6,550 per MP.
• Volkswagen emissions scandal: 1.2 million UK owners face car recall
Although overall claims fell year-on-year in 2014/15, the figures are still nearly £13,000 higher than in 2012/13, despite the MP expense scandal uncovered in 2009. Perhaps unsurprisingly, the most frugal MPs for car usage can be found in London, where the 73 politicians spent just £196 each on tolls, Congestion Charges, parking and other car claims in 2014/15. MPs in the capital have slashed their car expenditure by nearly a third, from a total of £19,899 in 2012/13 to just £14,338 in 2014/15.
Top 5 MP motoring expense claimants:
- • George Galloway (Respect/Bradford West) £11,676
- • Laurence Robertson (Con/Tewkesbury) £11,671
- • David Morris (Con/Morecambe & Lunesdale) £11,181
- • Khalid Mahmood (Lab/Birmingham Perry Barr) £10,293
- • Stephen O’Brien (Con/Eddisbury) £9,916
Some members are still claiming high expenses for car use, though. George Galloway, who lost his Bradford West seat at May’s General Election, tops the list as the highest-claiming MP in 2014/15.
The Respect party leader single-handedly racked up more expenses than two-thirds of London’s MPs put together. A spokesman told us Galloway claimed all £11,676 “for using his car for the round trip between his constituency and Westminster”. The 404-mile drive set the taxpayer back £182 a time, when a return train ticket for the same journey would have cost £128.
• UK smoking ban: smoking in cars with kids now illegal
Jonathan Isaby, chief executive of the TaxPayers’ Alliance, told Auto Express: “The publication of all travel claims plays an essential part in enabling constituents to scrutinise whether their MPs have proven to be good value for money. “With the publication of these figures, MPs will be reminded just how expensive travelling has become for motorists.”
How MPs’ expenses compare by region
| Region | 2012-2013 | 2013-2014 | 2014-2015 |
| South West | £171,582 | £181,384 | £179,629 |
| West Midlands | £184,306 | £186,852 | £179,147 |
| Wales | £140,704 | £159,949 | £156,950 |
| Yorkshire and Humberside | £161,686 | £166,138 | £155,997 |
| North West | £151,503 | £156,897 | £152,256 |
| South East | £130,478 | £145,229 | £138,501 |
| East Midlands | £137,533 | £140,640 | £131,861 |
| Scotland | £133,539 | £134,903 | £128,566 |
| East of England | £119,540 | £114,935 | £115,268 |
| North East | £47,888 | £52,390 | £59,018 |
| London | £19,899 | £17,995 | £14,338 |
| Totals | £1,398,658 | £1,457,312 | £1,411,530 |
Should MPs be claiming this kind of money in car costs? Have your say in the comments section below...
Find a car with the experts
