Motorists face postcode lottery over car labour rates
Figures reveal huge variations in hourly workshop charges according to postcode

Think your dealer is charging too much? It might just be down to where you live, because our exclusive data reveals how the cost of labour is a postcode lottery.
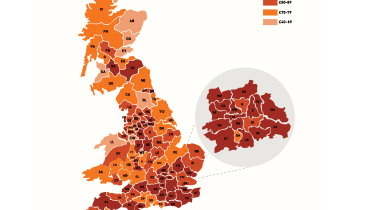
The figures – produced by Warrantywise – highlight the huge disparity in hourly rates across Great Britain. The cheapest average can be found in Kirkwall, Orkney, with mechanics charging just £44 per hour compared to the priciest in Twickenham, south west London, at £141 per hour. That’s a difference of more than 200 per cent across 700 miles.
The highest recorded hourly rate of an individual garage was £240 per hour in West Byfleet, Surrey, with the lowest cost found to be £36 per hour at a garage in Smethwick, Birmingham – a staggering 566 per cent difference.
Regionally, Scotland as a whole has the lowest hourly rates, at just £71.42 compared to the £101.60 charged in the capital. London is the only area to top £100 and is some way above the UK average of £84.30 per hour.

Click here, or on the image above, for the full image.
Lawrence Whittaker, CEO of Warrantywise, said: “Some of the differences Warrantywise has discovered are, frankly, offensive. Our advice is simple: shop around, negotiate and remember that as a paying customer, you are holding the ace cards.”
Cost isn’t just down to region, though, with some networks charging more.
Despite motorists paying a premium, Auto Express’s Driver Power satisfaction survey, which polled more than 61,000 motorists, has revealed that Brits are happier than ever with their dealers.
The average satisfaction score was 87.84% - up from 86.83% in 2014. Nearly 50 per cent of the motorists who took part said they would be “highly likely” to recommend their dealer to a friend.
Click here to read more about this year's Driver Power dealer results.
Dealer labour rates by region and postcode
| LONDON: £101.60 an hour average | |||
| N | £81 | W | £111 |
| E | £97 | BR | £121 |
| LU | £82 | SM | £76 |
| MK | £94 | SW | £109 |
| CM | £89 | RH | £103 |
| EN | £111 | WD | £120 |
| HA | £106 | CR | £108 |
| SE | £85 | RM | £90 |
| NW | £99 | KT | £129 |
| AL | £106 | SL | £108 |
| DA | £105 | TN | £97 |
| IG | £101 | CT | £95 |
| TW | £141 | HP | £104 |
| UB | £98 | GU | £98 |
| CO | £93 | SS | £98 |
| SG | £87 | ME | £101 |
| SCOTLAND: £71.42 an hour average | |||
| KW | £44 | AB | £63 |
| KY | £59 | PA | £74 |
| IV | £72 | PH | £71 |
| EH | £72 | G | £74 |
| DD | £69 | FK | £80 |
| DG | £72 | TD | £91 |
| ML | £94 | KA | £65 |
| NORTH WEST: £84.72 an hour average | |||
| CA | £74 | BD | £84 |
| WA | £86 | SK | £94 |
| HD | £88 | OL | £97 |
| LA | £83 | BB | £84 |
| PR | £86 | S | £82 |
| HX | £87 | LS | £95 |
| M | £75 | WF | £90 |
| CH | £88 | HG | £87 |
| WN | £78 | BL | £82 |
| L | £81 | FY | £92 |
| CW | £66 | ||
| SOUTH: £86 an hour average | |||
| GL | £72 | OK | £85 |
| SO | £76 | PO | £79 |
| SN | £96 | RG | £98 |
| BN | £95 | SP | £74 |
| BH | £99 | ||
| MIDLANDS: £83.77 an hour average | |||
| NG | £89 | ST | £109 |
| WS | £56 | NN | £75 |
| DE | £94 | HR | £79 |
| TF | £74 | B | £74 |
| LE | £83 | CV | £89 |
| WV | £73 | WR | £109 |
| DY | £85 | ||
| NORTH EAST: £76.33 an hour average | |||
| LN | £86 | TS | £75 |
| DN | £79 | DH | £81 |
| NE | £75 | SR | £96 |
| HU | £71 | YO | £73 |
| DL | £51 | ||
| SOUTH WEST: £89.12 an hour average | |||
| BS | £91 | BA | £85 |
| TA | £80 | EX | £95 |
| TQ | £71 | PL | £81 |
| TR | £85 | ||
| WALES: £77 an hour average | |||
| LL | £64 | SY | £83 |
| CF | £86 | SA | £75 |
| NP | £78 | LD | £76 |
| EAST: £88.75 an hour average | |||
| PE | £77 | NR | £81 |
| CB | £109 | IP | £88 |
What do you think about garage labour rates? Have you had any big bills recently? Let us know in the comments section below...
Find a car with the experts


