PSA Peugeot Citroen reveals real-world fuel economy for 30 cars
PSA becomes the first carmaker to reveal real world fuel economy figures alongside the title of least polluting carmaker in Europe

PSA Peugeot Citroen has published real world fuel consumption figures for 30 of its cars, with Citroen, Peugeot and DS models found on average 22mpg less efficient than their claimed figures suggest.
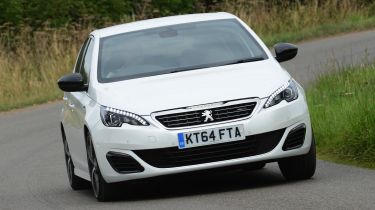
The Group released the real world economy figures for some of its best selling models like the Peugeot 308, Citroen C4 Picasso and the DS 3. On average, real world fuel economy for the 14 different Peugeot models tested was off by 22.34 mpg from the claimed figures - with cars like the 308 1.6 BlueHDi 120 S&S BVM6 over 30mpg less efficient. The average fuel economy for Citroen and DS models tested were off by 22.77 mpg and 20.87 mpg from the claimed figures.
The decision to publish real world fuel economy figures follows a much-applauded pledge of transparency from the PSA Group. Following last year's emissions and fuel economy scandals, the Group joined forces with environmental organisation Transport & Environment to conduct real world fuel economy tests.
• New details on 'T-Charge' plan to hit London's most polluting cars
The measurements were made on public roads open to traffic, with 25km (15.5 miles) in urban, 39km (24.23 miles) in rural, and 31km (19.26 miles) on motorways, with passengers and luggage on board. A portable emissions measurement system (PEMS) - identical to those which will be used in the upcoming Real Driving Emissions tests - was used to record average fuel consumption.
The Group is planning to publish real world figures for a further 20 models by the end of 2016, and looks to launch an online simulator on its websites to enable owners and potential buyers to predict their vehicles’ fuel consumption based on driving style and road conditions.
Gilles Le Borgne, Executive Vice President, Research & Development at PSA Peugeot Citroen, said: "The PSA Group has today published real-world consumption data for 30 Peugeot, Citroën and DS models, in line with the commitment to transparency made in October 2015.
• UK's best selling plug-in cars revealed
"As part of its drive to continuously provide customers with more information, the Group will publish figures for another 20 models by the end of the year and introduce a simulator allowing customers to reduce their fuel consumption depending on driving conditions, thereby lowering their CO2 emissions. In 2017, the PSA Group will move to the next level by extending measurements to pollutant emissions of nitrogen oxides (NOx) in customer driving conditions."
| 14 PEUGEOT MODELS | Real world mpg | Claimed mpg | Difference |
| 108 1.2l PureTech 82 BVM5 15'' STD tyres | 46.30 | 65.69 | 19.39 |
| 208 1.6l BlueHDi 100 BVM5 16'' VLRR tyres | 60.10 | 80.71 | 20.61 |
| 208 1.6l BlueHDi 120 S&S BVM5 16'' ULRR tyres | 60.10 | 94.16 | 34.06 |
| 2008 1.6l BlueHDi 100 BVM5 16'' VLRR tyres | 55.38 | 76.35 | 20.97 |
| 2008 1.6l BlueHDi 120 S&S BVM6 16'' VLRR tyres | 54.32 | 76.35 | 22.03 |
| 2008 1.2l PureTech 82 BVM5 16'' VLRR tyres | 44.13 | 57.65 | 13.52 |
| 2008 1.2l PureTech 110 S&S EAT6 16'' VLRR tyres | 39.79 | 58.85 | 19.06 |
| 308 1.6l BlueHDi 120 S&S BVM6 16'' ULRR tyres | 57.65 | 88.28 | 30.63 |
| 308 1.2l PureTech 130 S&S BVM6 16'' VLRR tyres | 42.80 | 61.41 | 18.61 |
| 308 1.2l PureTech 110 S&S BVM5 16'' ULRR tyres | 44.84 | 70.62 | 25.78 |
| 3008 1.6l BlueHDi 120 S&S BVM6 17'' VLRR tyres | 46.31 | 68.90 | 22.59 |
| 3008 1.2l PureTech 130 S&S BVM6 17'' ULRR tyres | 37.17 | 57.65 | 20.48 |
| 508 2.0l BlueHDi 180 S&S EAT6 17'' ULRR tyres | 44.84 | 70.62 | 25.78 |
| PARTNER 1.6l BlueHDi 120 S&S BVM5 15'' VLRR tyres | 46.31 | 65.69 | 19.38 |
| 11 CITROËN MODELS | Real world mpg | Claimed mpg | Difference |
| C1 PureTech 82 BVM Feel 15'' STD tyres | 46.31 | 65.69 | 19.38 |
| C3 PureTech 82 BVM Exclusive 16'' VLRR tyres | 44.84 | 61.41 | 16.57 |
| C3 Picasso BlueHDi 100 BVM Confort 16'' VLRR tyres | 49.56 | 74.34 | 24.78 |
| C3 BlueHDi 75 S&S BVM 15'' ULRR tyres | 57.65 | 94.16 | 36.51 |
| C4 Cactus BlueHDi 100 BVM Shine 16'' VLRR tyres | 55.39 | 78.47 | 23.08 |
| C4 Cactus PureTech 110 S&S BVM Shine 16'' VLRR tyres | 46.31 | 65.69 | 19.38 |
| C4 BlueHDi 100 BVM Feel 16'' VLRR tyres | 55.39 | 78.47 | 23.08 |
| C4 Picasso BlueHDi 120 S&S EAT6 Intensive 17'' VLRR tyres | 43.46 | 72.43 | 28.97 |
| Grand C4 Picasso BlueHDi 120 S&S BVM6 Attraction | 49.56 | 70.62 | 21.06 |
| Grand C4 Picasso PureTech 130 S&S BVM6 Intensive | 38.17 | 56.50 | 18.32 |
| Berlingo BlueHDi 100 BVM 15'' VLRR tyres | 46.31 | 65.69 | 19.38 |
| 3 DS MODELS | Real world mpg | Claimed mpg | Difference |
| DS 3 BlueHDi 120 S&S BVM6 Sport Chic | 56.49 | 78.47 | 21.97 |
| DS 3 PureTech 110 S&S BVM So Chic | 47.08 | 65.69 | 18.61 |
| DS 4 PureTech 110 S&S BVM So Chic | 52.31 | 74.34 | 22.03 |
| (STD = standard, VLRR = very low rolling resistance, ULRR = ultra low rolling resistance) |
Peugeot has lowest car CO2 emissions in Europe
Another victory for the environmentalists is that the average CO2 emissions for new cars continues to fall across Europe, with average CO2 emissions totalling 119.3g/km for new vehicles, down 3.2 per cent from the previous year.
Peugeot is the new emissions leader, just ahead of Citroen and Renault, with average vehicle CO2 emissions totalling 103.5g/km – an improvement of 5.8g/km from the previous year.
Part of the impressive cuts in emissions comes down to the frugal 1.0-litre 3-cylinder engines found in small cars like the 108. However, it wasn’t just the superminis that were leading the charge, hatchbacks like the 308 also saw average CO2 figures dipping below 100g/km for the first time.
The only carmakers that showed an increase in CO2 figures were Fiat and Nissan. Fiat saw a 0.3g/km rise in fleet CO2 averages between 2014 and 2015, while Nissan reported a 0.5g/km increase.
| Position 2015 | Make | Average CO2 2015 (g/km) | Average CO2 2014 (g/km) | Change | Position 2014 |
| 1 | Peugeot | 103.5 | 109.3 | -5.8 | 2 |
| 2 | Citroën | 105.7 | 110.8 | -5.1 | 3 |
| 3 | Renault | 105.9 | 108.4 | -2.4 | 1 |
| 4 | Toyota | 107.7 | 112.5 | -4.9 | 4 |
| 5 | Nissan | 114.3 | 113.8 | 0.5 | 5 |
| 6 | Skoda | 115.4 | 121.5 | -6.2 | 8 |
| 7 | Seat | 116.8 | 117.4 | -0.6 | 6 |
| 8 | MINI | 117.0 | 122.1 | -5.1 | - |
| 9 | Fiat | 117.8 | 117.4 | 0.3 | 7 |
| 10 | Volkswagen | 117.8 | 123.4 | -5.6 | 10 |
| 11 | Ford | 118.1 | 121.8 | -3.6 | 9 |
| 12 | Dacia | 121.9 | 125.7 | -3.8 | 12 |
| 13 | Volvo | 123.8 | 126.4 | -2.6 | 13 |
| 14 | Opel/Vauxhall | 126.3 | 130.3 | -3.9 | 16 |
| 15 | Audi | 127.3 | 132.4 | -5.0 | 18 |
| 16 | Mazda | 127.4 | 128.9 | -1.4 | 14 |
| 17 | Hyundai | 127.5 | 129.8 | -2.3 | 15 |
| 18 | Kia | 127.7 | 130.9 | -3.2 | 17 |
| 19 | BMW | 128.0 | 133.0 | -5.0 | 19 |
| 20 | Mercedes | 128.2 | 133.5 | -5.3 | 20 |
Will real fuel economy figures matter to you when purchasing your next car? Tell us in the comments below...
Find a car with the experts


